The Pet Resort Market Opportunity Report
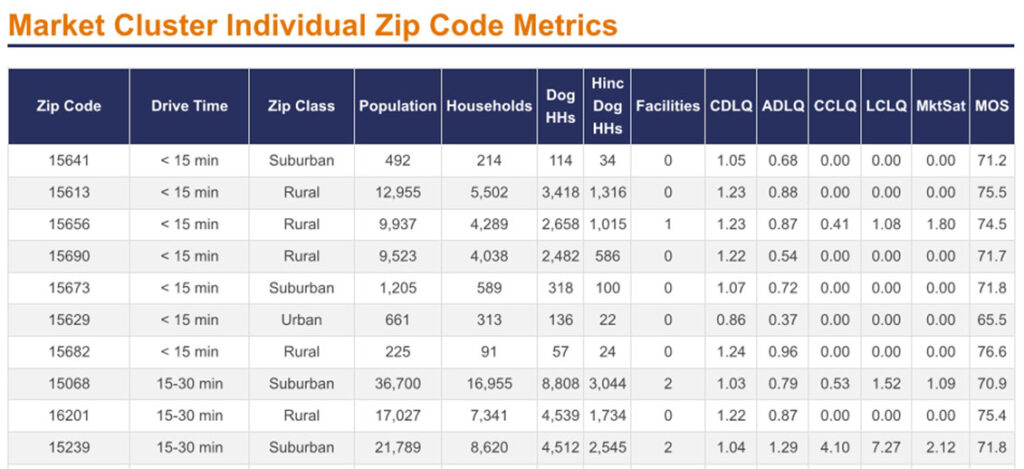
The Pet Resort Market Opportunity Report provides significant insight into how effective Pet Resorts are reaching and converting the dog households in their market, with special insight into Affluent Dog Households (with incomes >=$100,000). Markets were identified based on a given centroid zip code and then evaluated for surrounding zip codes based on drive times of less than 15 minutes, 15 to 30 minutes, 30 to 45 minutes and 45 to 60 minutes. Markets were assigned based on population density to Rural, Suburban and Urban areas, which dictated which drive times were considered. Urban areas were restricted to 30 minutes or less drive times, Suburban areas to 45 minutes or less, and Rural up to 60 minutes.
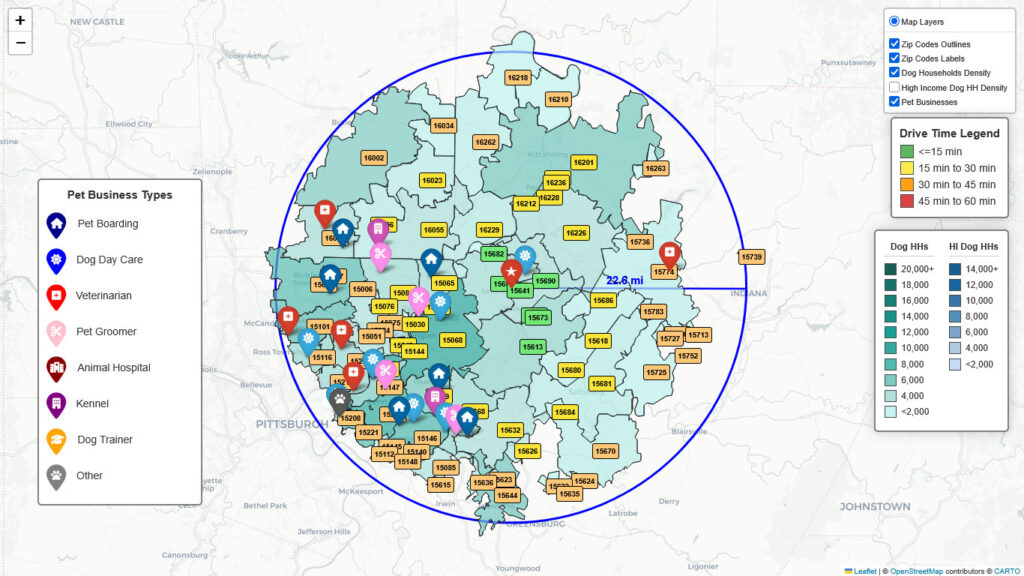
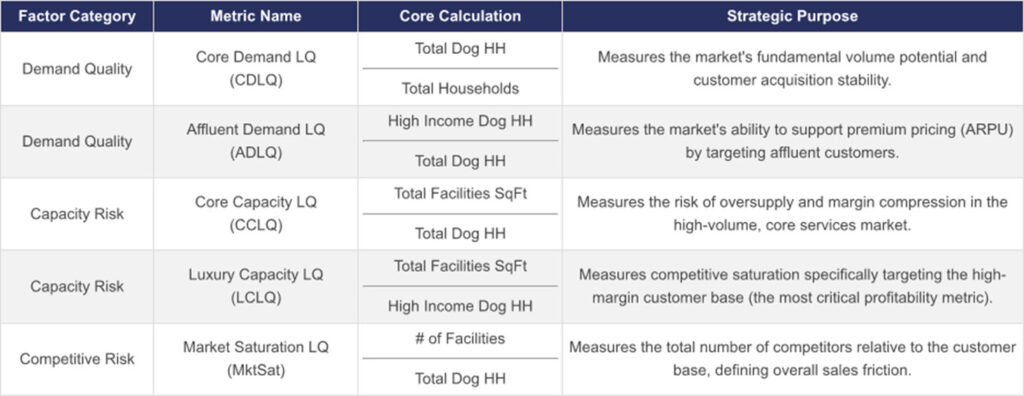
Nehmedia, the provider of the report, through its Pet Resort Marketing (PetResortmarketing.com) service did an in-depth study evaluating the six factors in that impact a pet resort’s business. These factors are all compared to a national average.
- Core Demand: How many dog households are in each market.
- Affluent Demand: How many affluent dog households with incomes over $100,000 are in a market.
- Core Capacity: The estimated total square footage in identified facilities that provide pet boarding and or dog daycare services divided by the number of dog households in a market.
- Luxury Capacity: The estimated total square footage in identified facilities (providing boarding and daycare) divided by the number of affluent dog households.
- Market Saturation: The total number of facilities providing boarding and daycare is divided by the number of dog households.
- Market Opportunity Score: The weighted average score of the previous five factors for a given market.
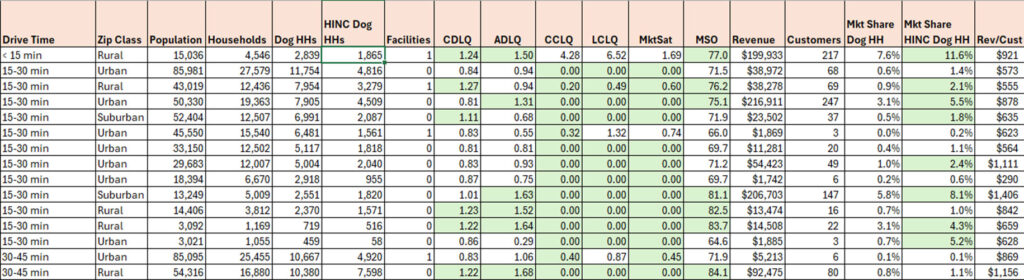
Using the scoring of zip codes served, Nehmedia sampled 9 pet resort revenues (~$18M annually) and customers (around 14,000 customers) by zip codes against it model and found some interesting insights. These are explained below.
- Affluent Dog Households Drive Revenue: In our study, zip codes with better performing Affluent Demand factors (Peak and Premium) accounted for 87.4% of a resort’s overall revenue.
- Market Share Matters: Based on our analysis, where pet resorts were able to capture at least 1.5% of the affluent dog households in their market, this was shown to account for on average 76.4% of a resort’s overall revenue.
- Core Capacity Indicates Opportunities: Where zip codes had low core capacity scores (, there were many more opportunities to generate revenue. Low Core Capacity scores accounted for an average of 60.7% of a pet resort’s revenue.
- Market Opportunity Scores (MOS) Support Higher Revenues: The study showed that strong MOS (Double Down and Strong Go) markets the average revenue per customer was 14% higher than average, while weaker MOS scores revenues per customer were 17% lower than average. Average customer revenue was $1,237/year in the study.
- Drive Times Accurately Cover Customer Base: Analyzing the revenue for each resort showed that on average 14.7% of the revenue was not included in the drive time zip codes included in the study. One factor was that around 5% to 7% of resort revenues lack a zip code due to retail or package purchase where the data was not captured. Another 6% to 10% were from people visiting or driving from outside the markets assigned zip codes.
How Pet Resort Investors and Owners Gain Value
The Pet Resort Market Opportunity Report transforms the high-stakes decision of capital allocation into a high-confidence investment strategy. This analysis is not based on theoretical models; it is validated by this dedicated study correlating our proprietary scoring system actual resort revenue data customer profiles. We prove that success is not found in volume, but in the surgical targeting of the high-value customer.
This report is your definitive strategic playbook, offering three immediate, financially validated insights:
- Guaranteed Profitability Focus: We eliminate the revenue guesswork. Our analysis confirms that Affluent Dog Households (>=$100K annual income) account for a staggering 87.4% of a resort’s overall revenue. The report surgically targets these highest-propensity customers within their traffic-adjusted drive times, ensuring your capital is invested solely in markets that support premium pricing and maximum profitability.
- De-Risked Investment and Predictable Returns: Stop investing in high-risk zones. Our validated Market Opportunity Scores (MOS) predict unit performance with high accuracy. Strong MOS markets (Double Down and Strong Go tiers) produce an average revenue per customer 14% higher than the mean, while weak markets produce 17% less. This score is your ultimate risk-mitigation tool for every acquisition or expansion decision.
- Identify and Capture Guaranteed Market Share: We pinpoint the easiest sales. The report identifies Supply Crisis markets where low Core Capacity scores guarantee high initial utilization, accounting for over 60.7% of top resort revenue. Furthermore, success is defined by capturing just 1.5% of the local affluent market, which drives three-quarters of your annual sales. This analysis provides the strategic intelligence needed to exceed your revenue goals rapidly by targeting the guaranteed capacity deficits in the market.
Invest in the Pet Resort Market Opportunity Report to move from high-risk guessing to high-confidence strategic value generation.