
Stop rebuilding your numbers every month. Start running on them.
The KPI Dashboard reads your Gingr data every night and turns it into the numbers owners and general managers actually run the business on: every service line, every customer tier, and who keeps coming back, each one compared with last year.
Sound familiar?
Gingr knows what you sold. It does not tell you how the business is doing.
Every month starts with an export.
Knowing whether boarding grew while daycare slipped means exporting your data and rebuilding the same spreadsheet by hand, every month.
Every customer looks the same.
The handful of families who carry your year sit in the same list as the one-time visitors, so nobody knows who to call first.
You can't see who stopped coming.
You cannot tell whether last year's new customers are still here, so you cannot tell marketing spend from marketing waste.
Your categories were set up years ago.
Reservation types and account codes were named by someone who has since moved on, and revenue lands in the wrong line or in Other.
Switch systems and your history dies.
Move to a new booking platform and years of revenue history stay behind in an account you are closing.
Every month starts with an export.
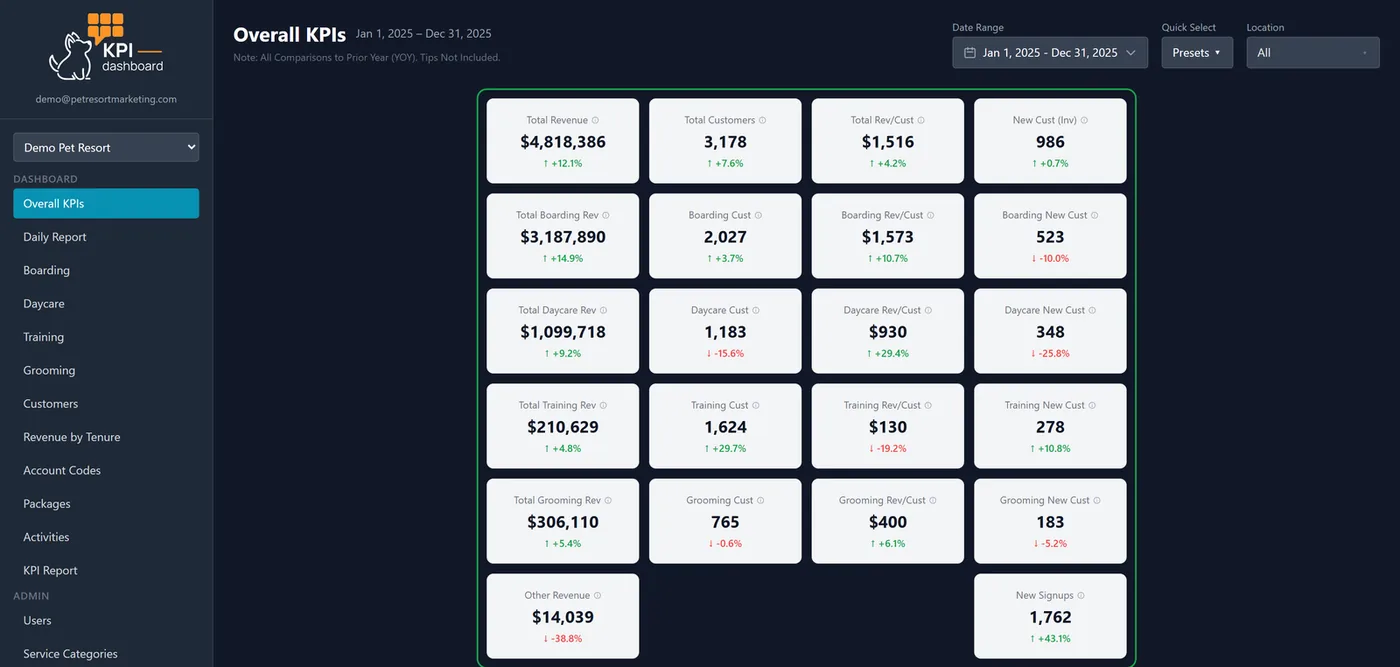
Every service line, against last year, before your coffee.
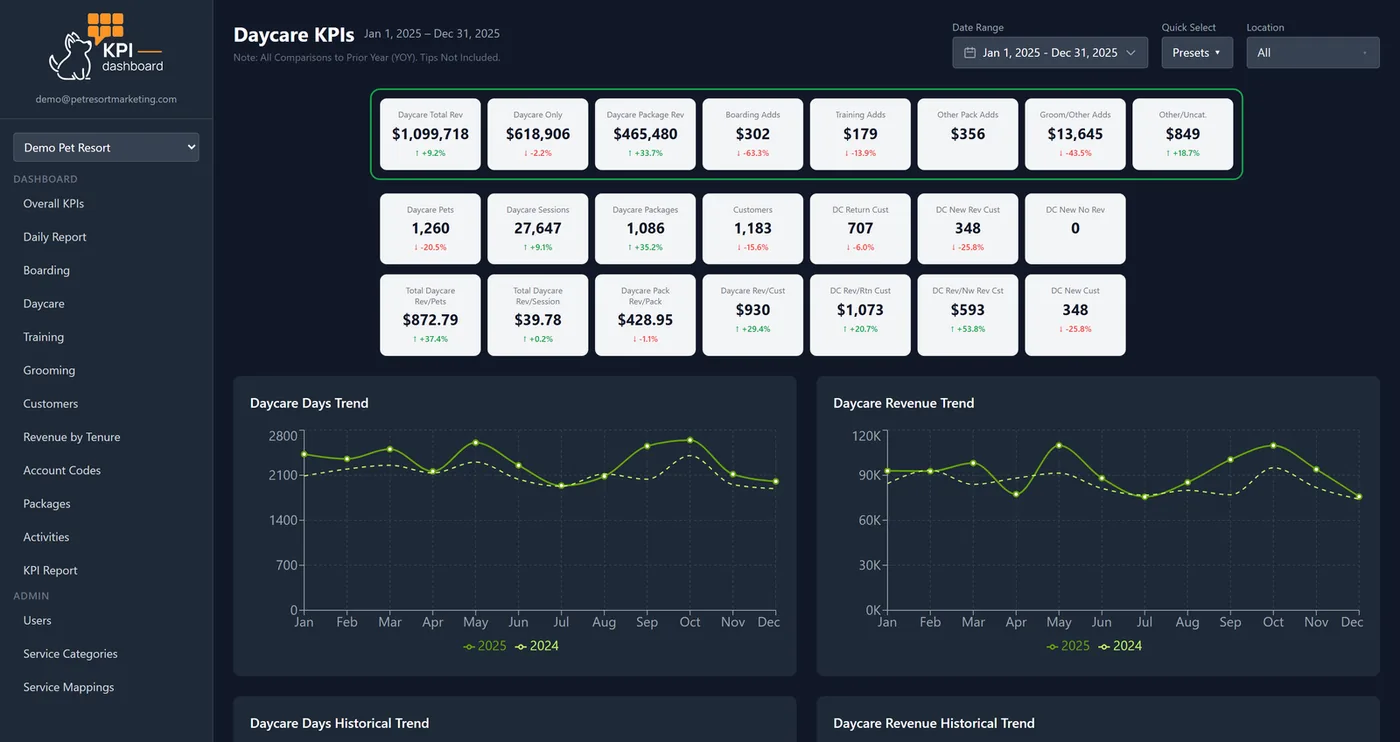
Every dollar is attributed to boarding, daycare, grooming, training or retail for any date range and any location, and each line carries its own volume and customer count. You see whether growth came from more stays or higher prices without opening a spreadsheet.
- Revenue, customers, revenue per customer and new customers, overall and per line
- Boarding pet-nights, daycare sessions and packages sold
- A daily view, and a PDF report of the whole thing in about ten seconds
Every customer looks the same.
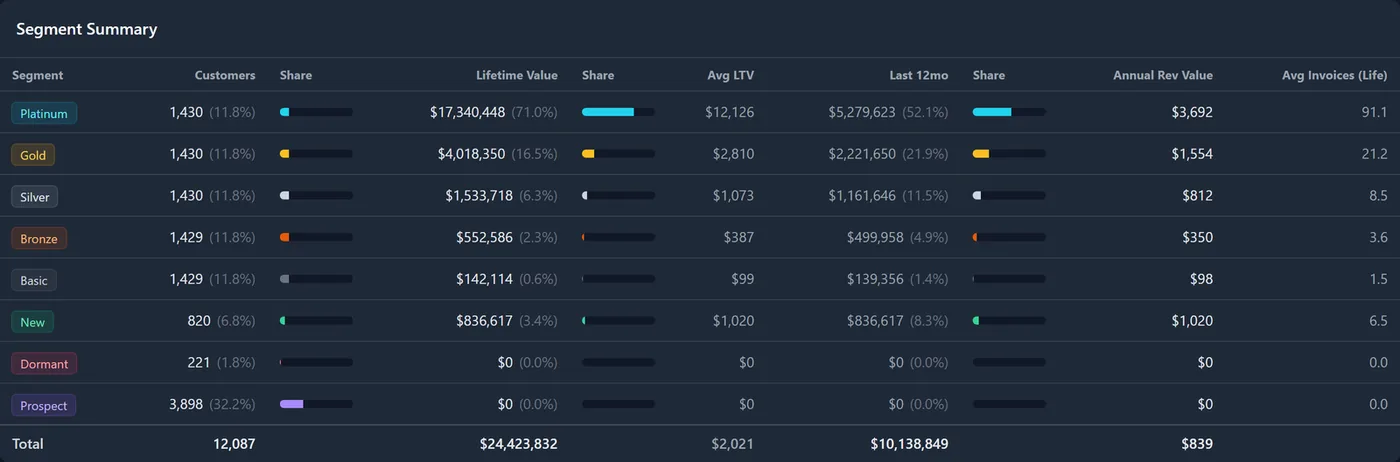
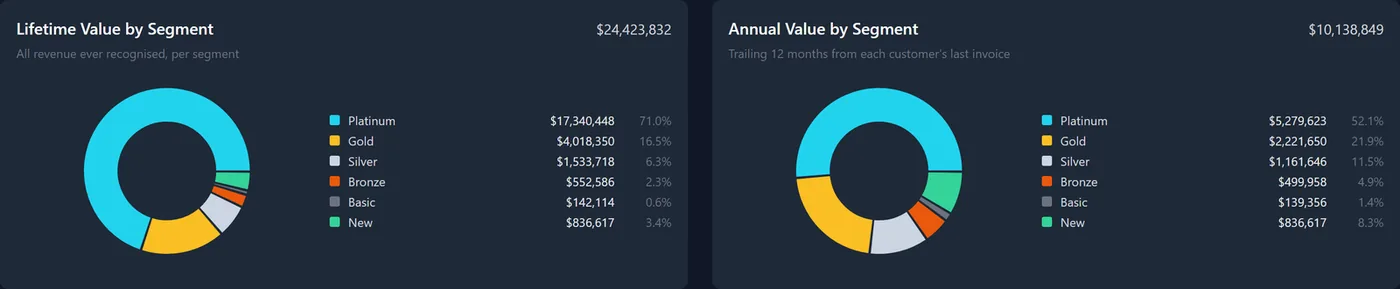
See the customers who carry your year.
Every customer is scored on what they have spent and sorted into tiers: Platinum, Gold, Silver, Bronze and Basic, plus New, Prospect and Dormant. Then see what each tier buys, in pet-nights, days and appointments as well as dollars.
That is the list your front desk should know by name, and the profile your marketing should look for more of.
88 to 92%of lifetime revenue comes from the top 40% of paying clients at the established resorts we measure.
You can't see who stopped coming.
Know where customers leak out, and when.
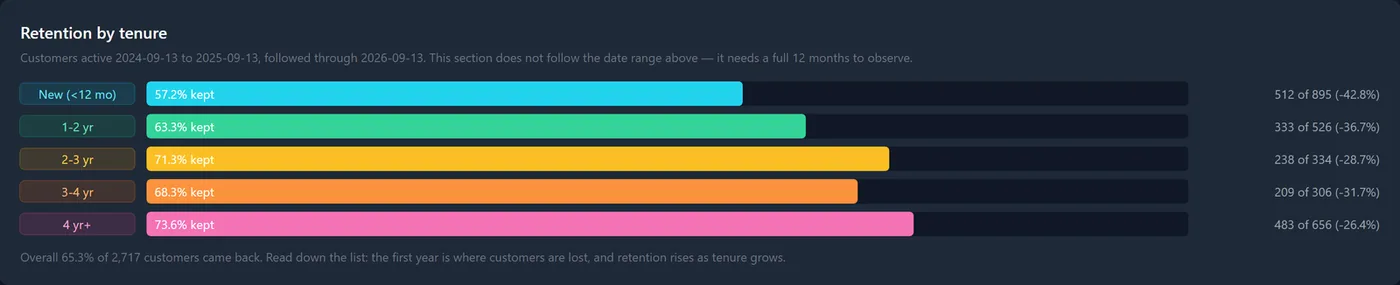
Revenue by Tenure groups customers by how long they have been with you, then follows each group forward twelve months to see who came back. The leak is almost always the first year, and now you can measure it, and measure whether your marketing fixed it.
- Retention by tenure, from first-year customers to four years and up
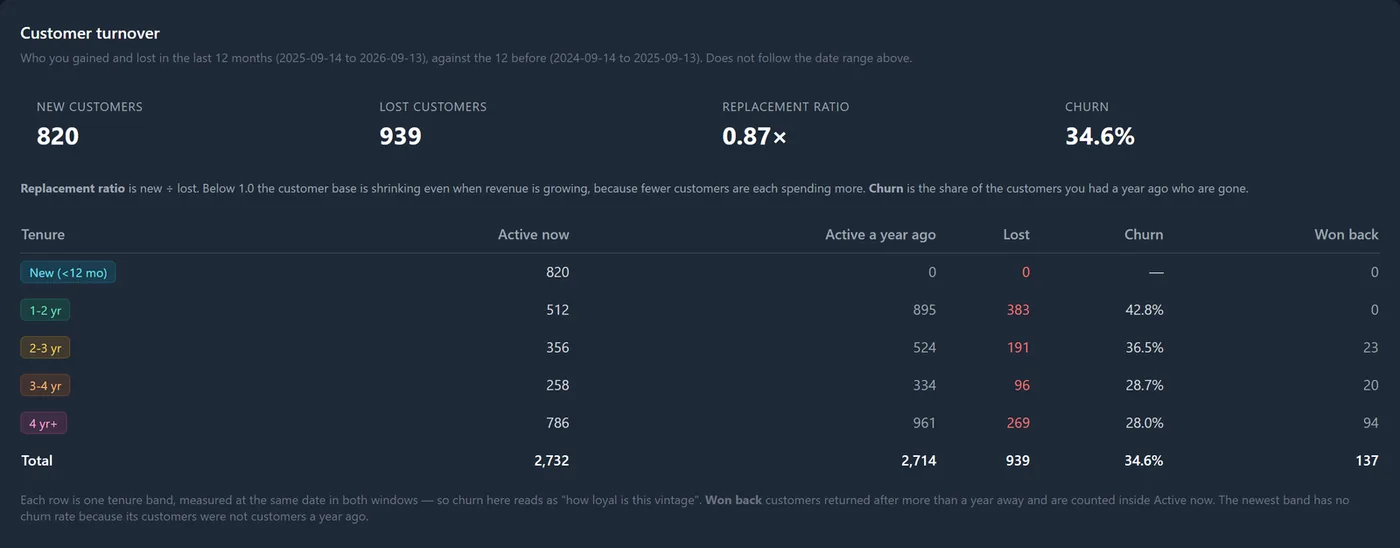
- New versus lost customers, and whether the base actually grew
- Win-backs: customers who returned after a year or more away
Which line is really carrying the business?
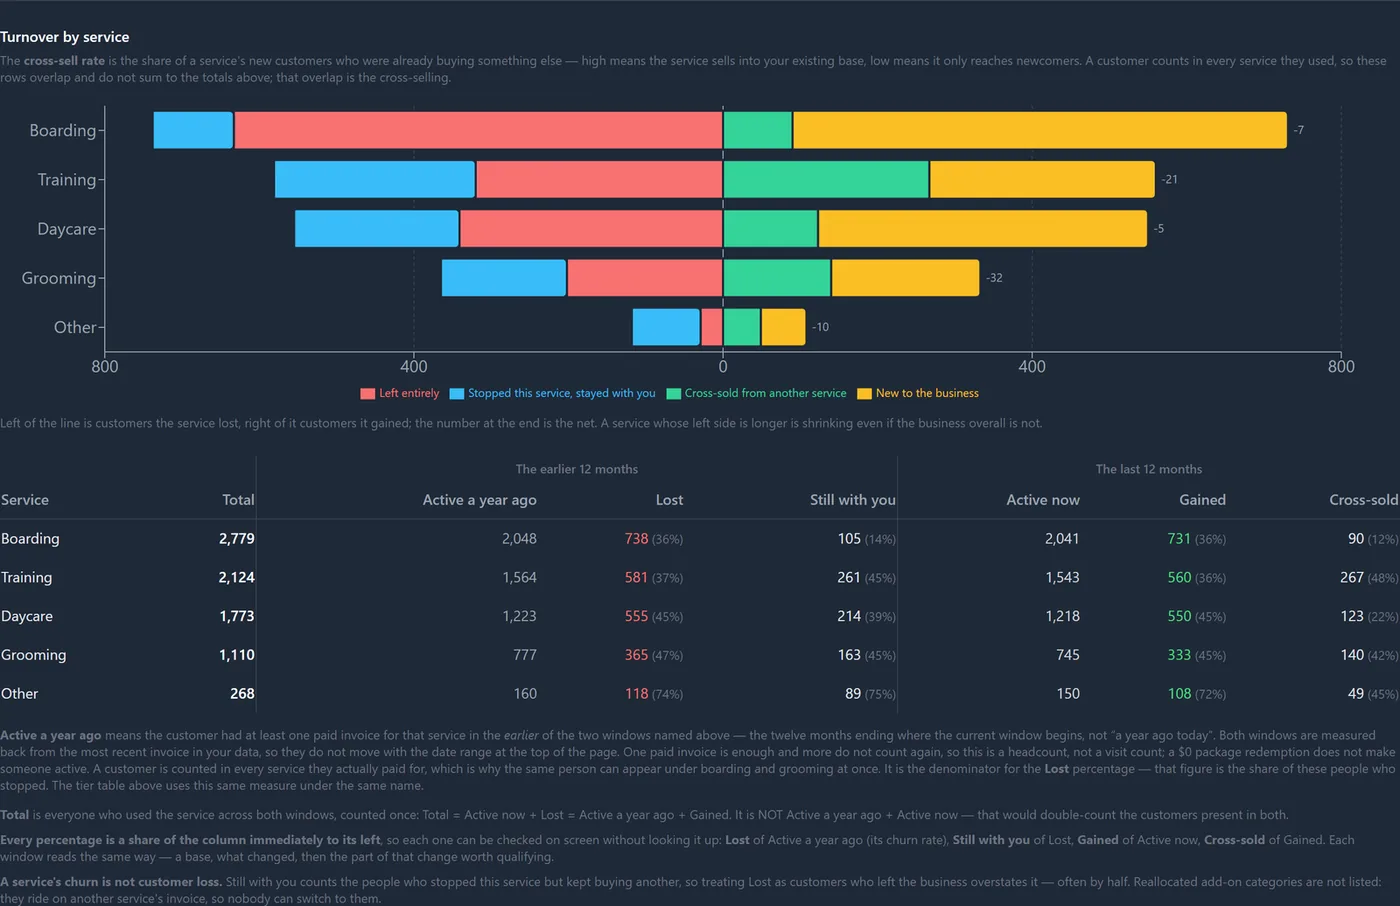
See which services win new customers and which lose them.
For every service you see how many customers it gained and lost, how many of the lost ones simply moved to another of your services, and what share of its new customers came from your existing base. That tells you which services to cross-sell, and which are leaking customers you will not get back.
Built for how resorts are run
Everything else that comes with it
Owners, general managers and bookkeepers each get what they need from the same numbers.
Your categories, your history
Map every reservation type and account code to the line you manage, split one across two lines when that is the truth, and re-derive every past month to match with one button.
Multi-location
Every location separately, any combination, or all of them at once, with year over year on each.
Access by location
Give a general manager their own location and nothing else.
Cash or accrual
Report revenue when the invoice was written or when the money arrived.
Exports that agree with the screen
Any table to CSV or Excel, from the same query as the page, plus a loyalty list of every paying customer.
Your history stays yours
Your revenue history lives in a database that belongs to you. Replace Gingr and every year you have already built stays reportable.
Some of this needs history to mean anything, and the history has to start somewhere. The clock starts when you connect.
match to Gingr's own Revenue-by-Date report
of resort revenue analyzed across 17 locations
~85%+ revenue
About 60% of your customers aren't driving value at most pet resorts.
How it works
It reads your Gingr data and never changes it.
There is nothing to install and nothing for your staff to change. Setup happens on our side.
Access
You give us read-only access to your Gingr data. That is all we need from you to begin.
Audit
We check your configuration first: codes not attached to reservation types, and types feeding the wrong line.
Load and map
We load your full history, reconcile it against Gingr's own revenue report month by month, and map your codes with you.
Go live
Logins for you and your managers, a refresh every night, and a health check every morning.
Questions owners ask
Before you ask
Can it change anything in Gingr?
No. The dashboard is read-only by design. It reports on a nightly copy of your data and can never change a reservation, an invoice or a customer record.
Do my staff have to do anything differently?
No. Staff keep booking exactly the way they do today. There is no plugin and no integration for your team to maintain.
How do I know the numbers are right?
Before you go live, we reconcile your history against Gingr's own Revenue-by-Date report month by month. The dashboard matches it to 99.9%.
We've only been open a year. Is it worth it?
Yes. Service line performance, customer tiers and the exportable customer list work from your first month. Year-over-year comparisons arrive at month 13 and retention after two years, and every month you wait is a month of history categorized however Gingr happened to be set up.
We have several locations. Can each manager see only theirs?
Yes. You see every location and any combination; each general manager can be limited to their own.
Talk to us
See it with your own numbers.
Book a 15-minute demo. Tell us a little about your resort and we will set up a time.
- Your own Gingr numbers, on screen, in 15 minutes
- Where your revenue really comes from, by service line
- Which customers carry your year
Prefer to call? (512) 900-1070 · [email protected]
Want the full details first? Read more about the KPI Dashboard
Preview: this is a copy of the site's existing contact form (Gravity Form 1). On the live page it submits normally, and its hidden fields record the QR code that was scanned.
Not affiliated with Gingr. Requires access to your Gingr nightly backups. Gingr is a trademark of its owner. Screens show the demo resort; measured figures are from client resorts and shown without names.