
Know where the right pet parents live. Before you build, advertise or expand.
Dog Households maps dog-owning and affluent dog-owning households for every neighborhood in the country, puts every competing pet business on the same map, and shows you where demand is strong and competition is thin.
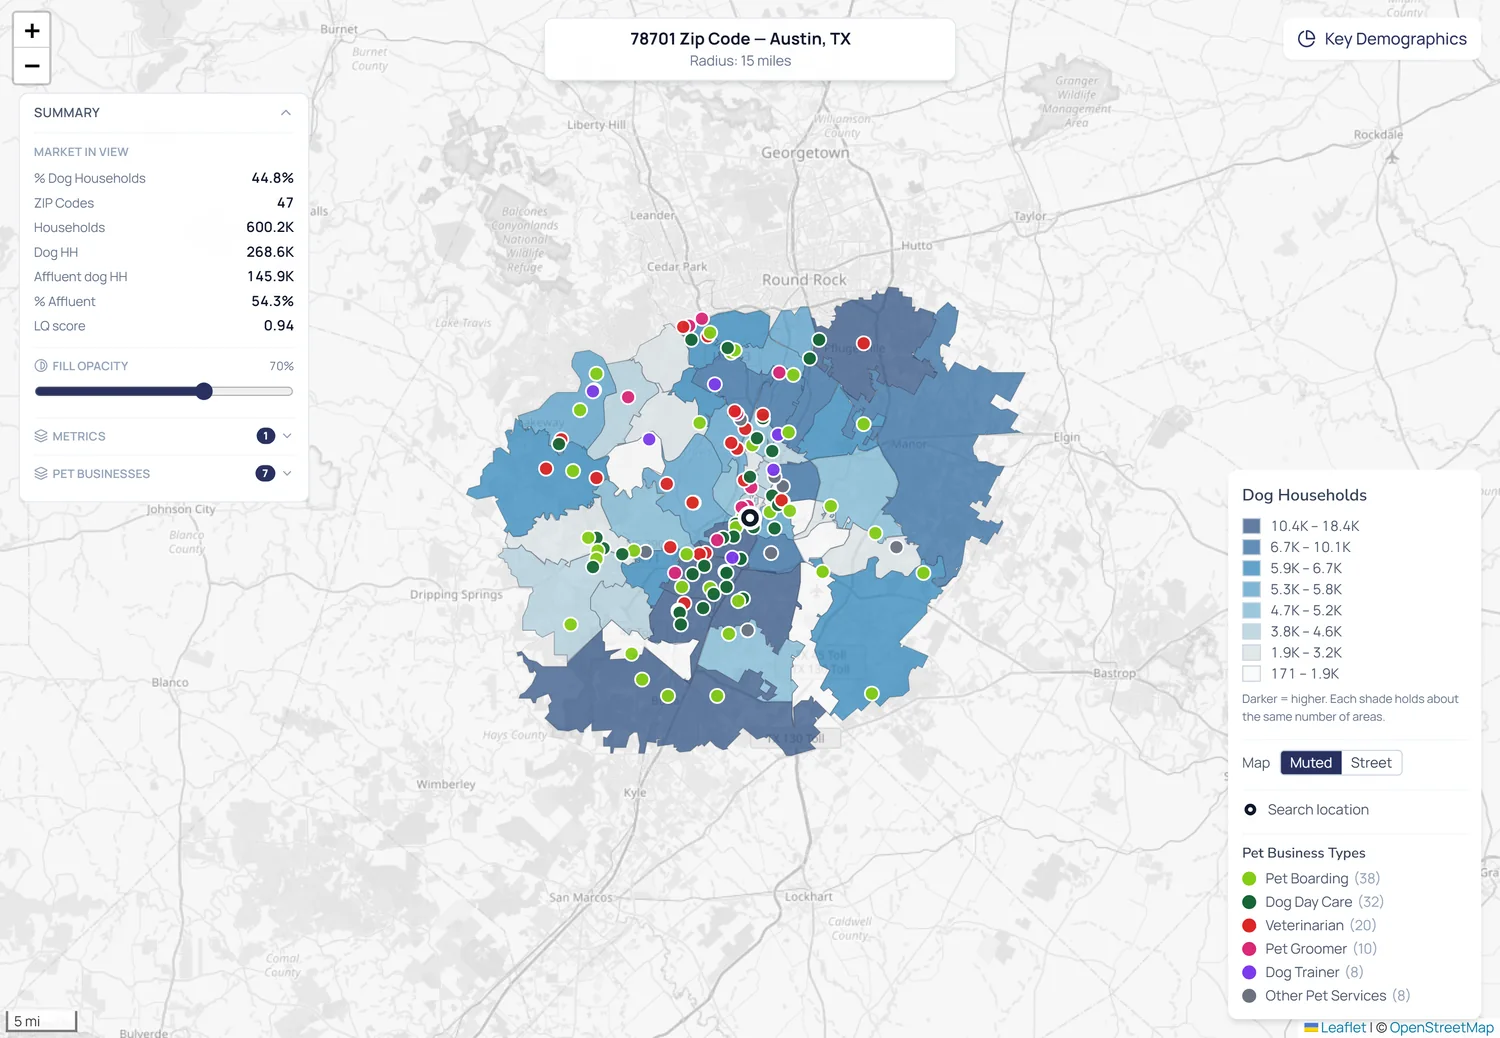
Sound familiar?
Most marketing and expansion decisions are made on a hunch.
Your ads cover the whole city.
Budget spreads across neighborhoods that will never drive to you, or never pay for premium boarding.
You've never mapped your own customers.
You know your best clients by name, but not which neighborhoods they come from or where more of them live.
You don't know who you're up against.
New competitors open quietly, and you find out when a regular mentions them.
You're choosing a site on gut feel.
A new location is a seven-figure decision, often made from a drive around town and a broker's flyer.
Your ads cover the whole city.
Aim every dollar at the neighborhoods that will book.
Boarding and daycare are convenience purchases, so start close: win the first five miles before spending outside them. Inside that circle, aim at the neighborhoods with the most affluent dog households and the least competition.
We turn the map into target lists for geofenced display ads, paid social and direct mail, so every channel aims at the same places.
- Neighborhood-level targeting for geofencing, paid social and direct mail
- Your best clients' neighborhoods and their look-alikes
- The same map used to plan, target and measure
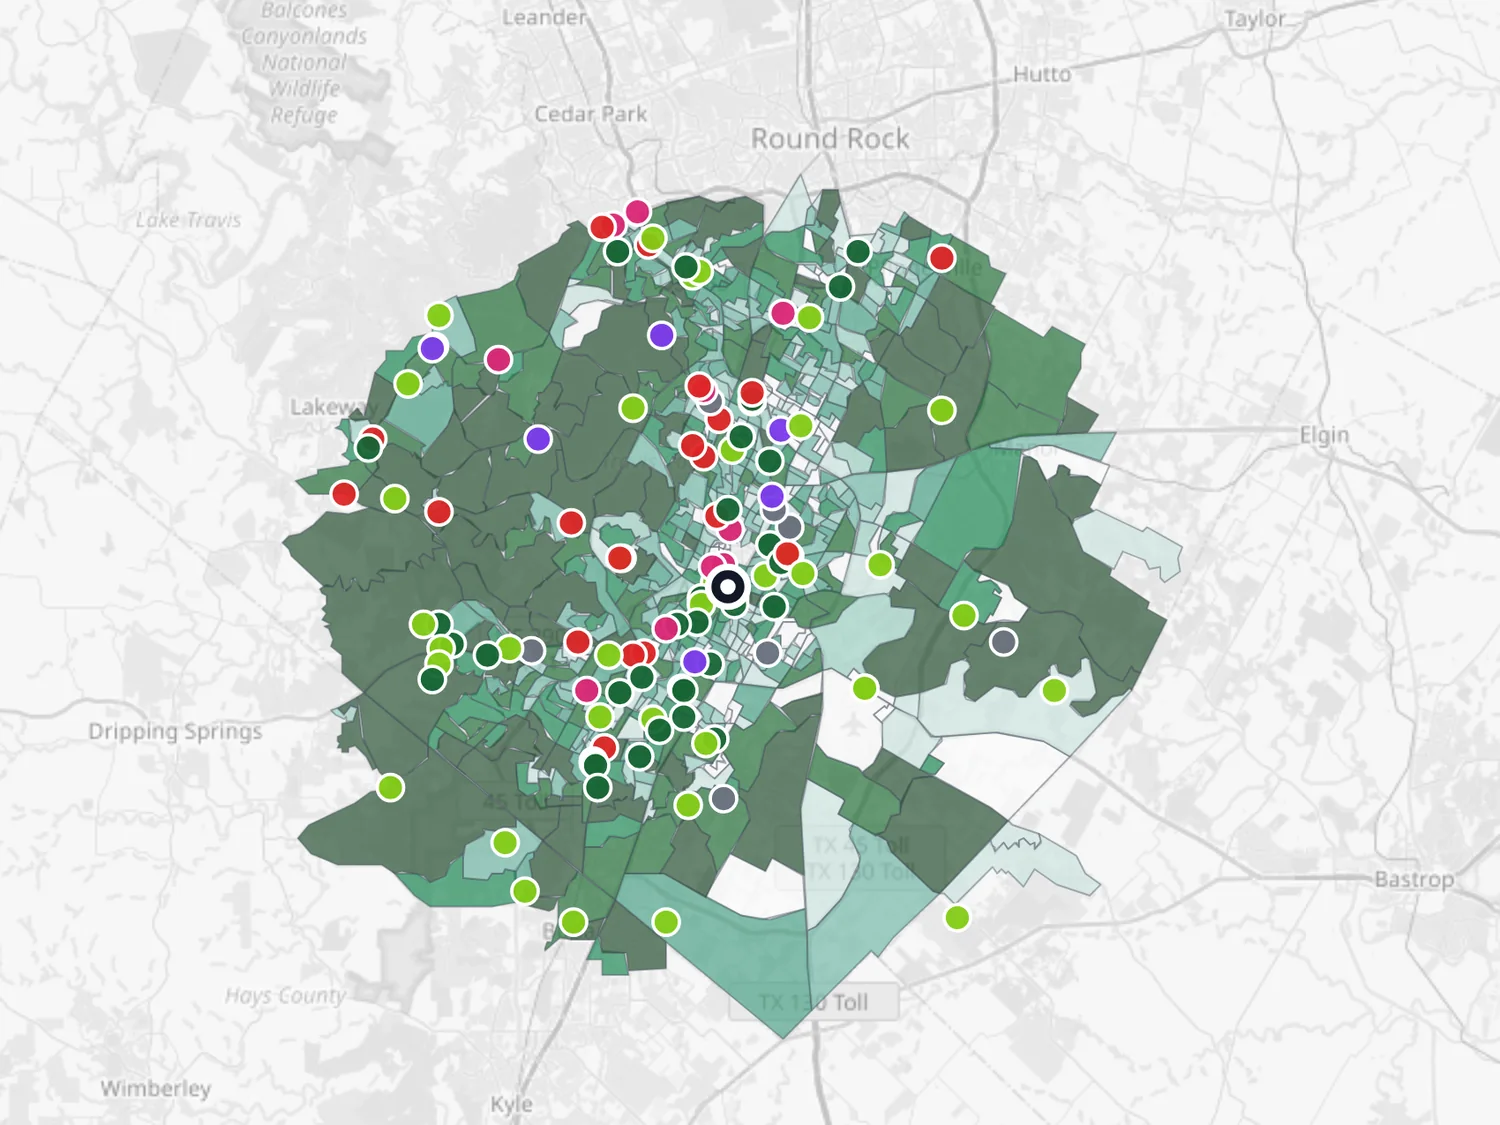
You've never mapped your own customers.
Map your customers, and find more like them.
Upload your client list and see your market share neighborhood by neighborhood: where your best clients cluster, where you are strong, and where you have barely started.
When we tested this across a trade area, the neighborhoods that hold a resort's customers were not dog-denser than the rest of the market. They were richer. Income, not dog counts, is the signal, which is why the map shows affluent dog households for every neighborhood.
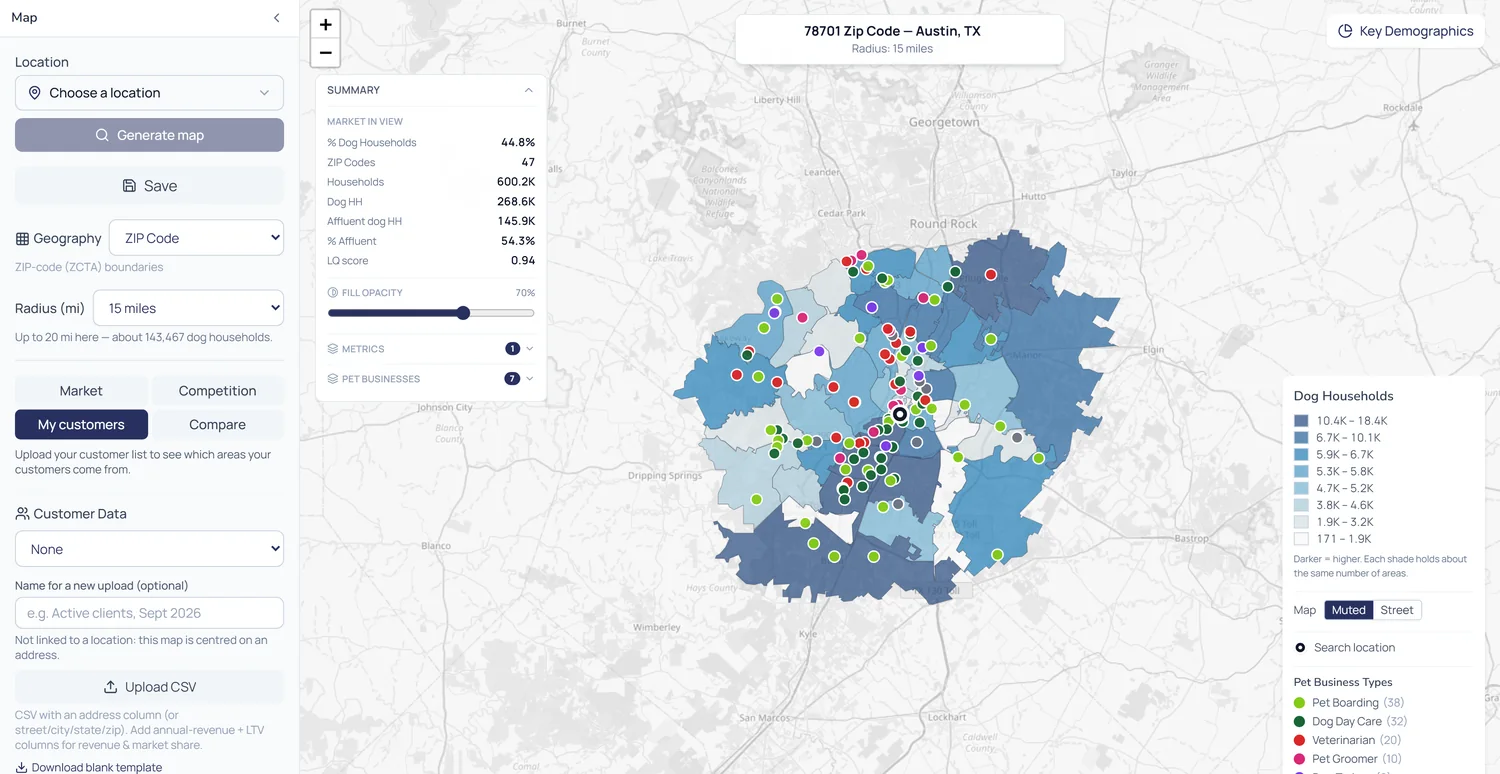
You don't know who you're up against.
See every competitor on the same map.
Our directory holds 20,406 boarding, daycare and kennel businesses with building sizes, plus vets, groomers and trainers, so you can see who already serves each neighborhood and how big they are.
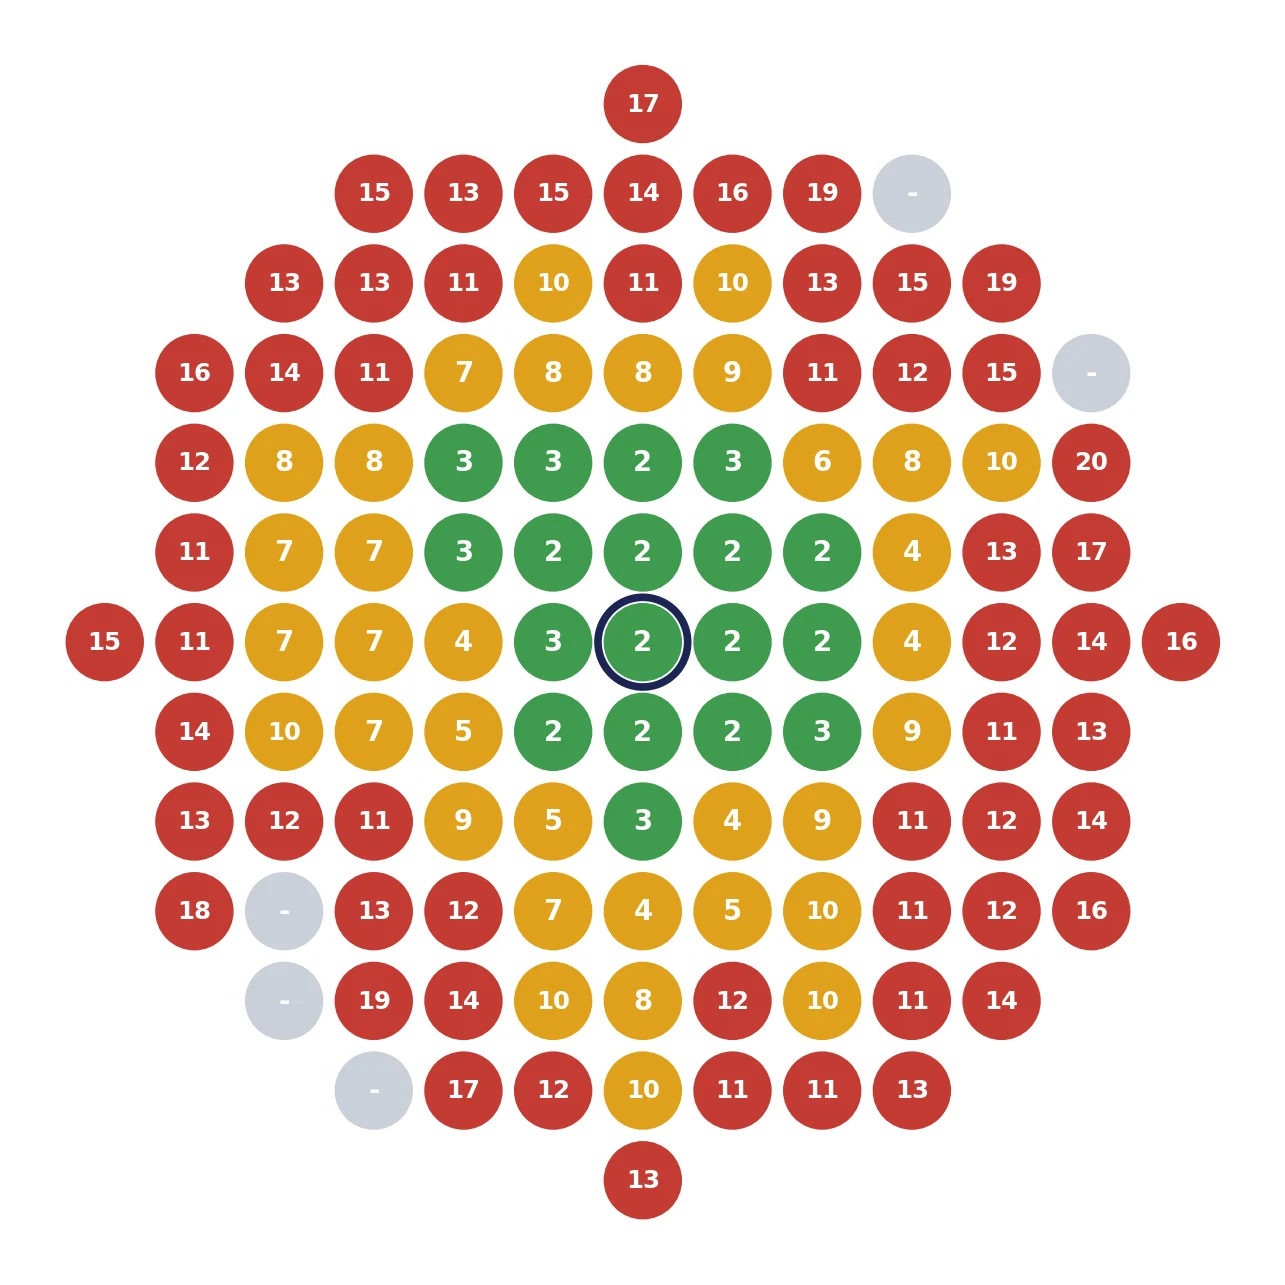
For your own locations, Google Maps rank grids show who ranks first for searches like dog boarding near me, street by street, across your area.
- Competitors by type: boarding, daycare, grooming, training, vets
- Building sizes, so you can judge capacity, not just count pins
- 113-point map pack and organic rank grids for your licensed locations
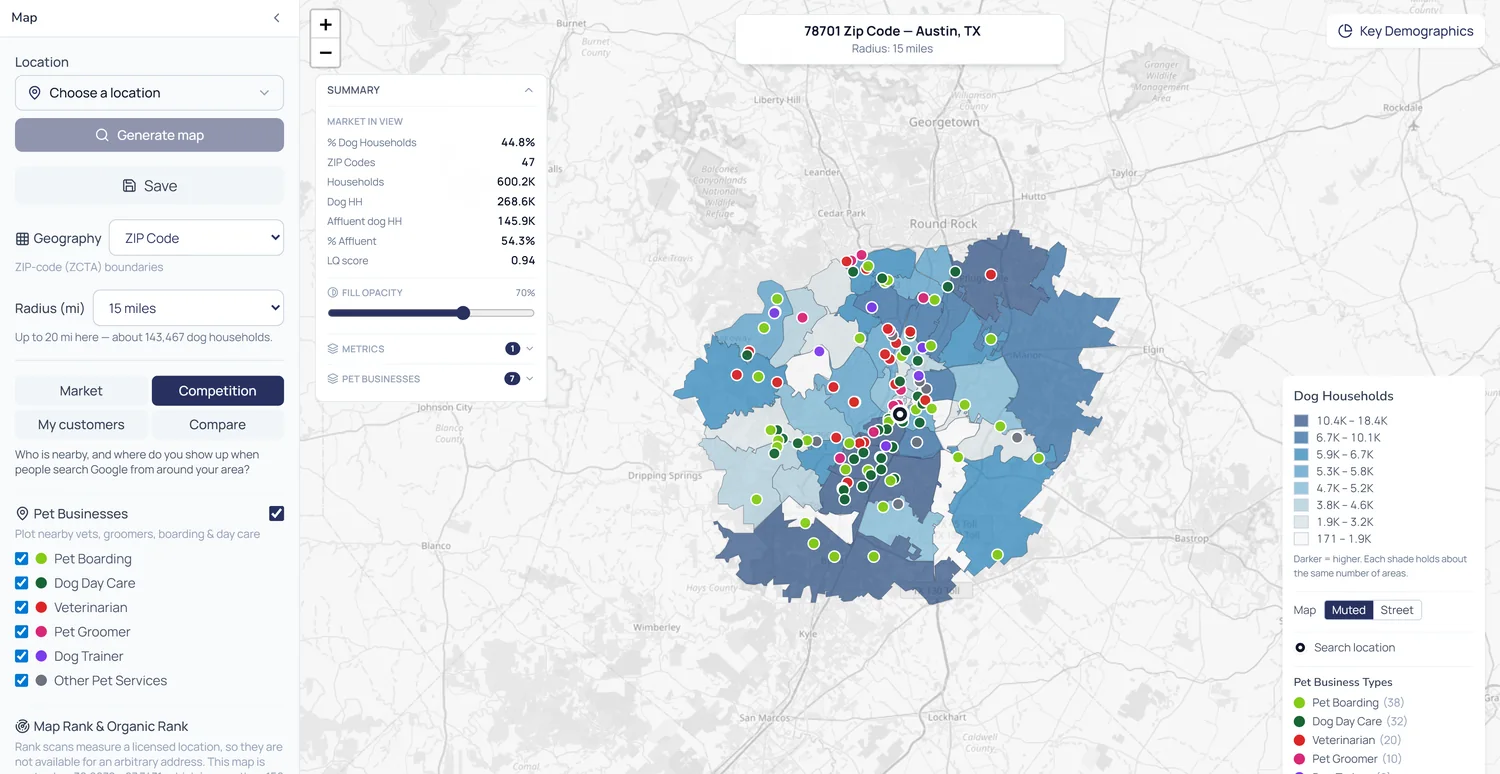
You're choosing a site on gut feel.
Find where to put your next resort.
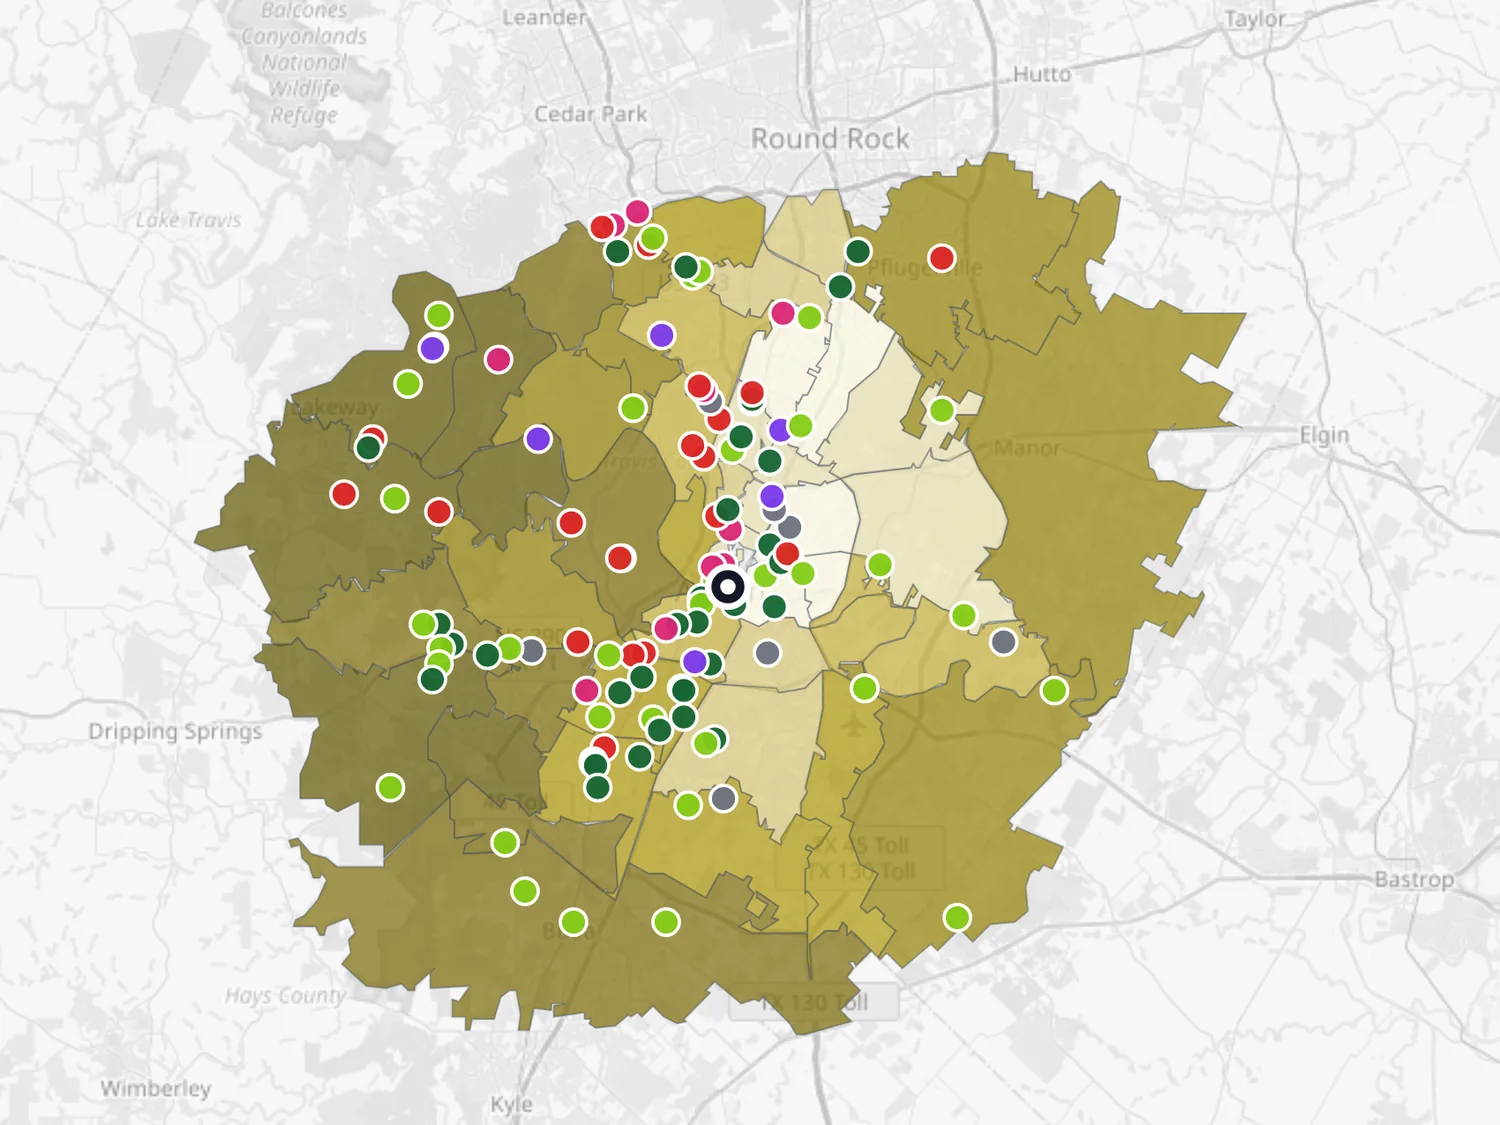
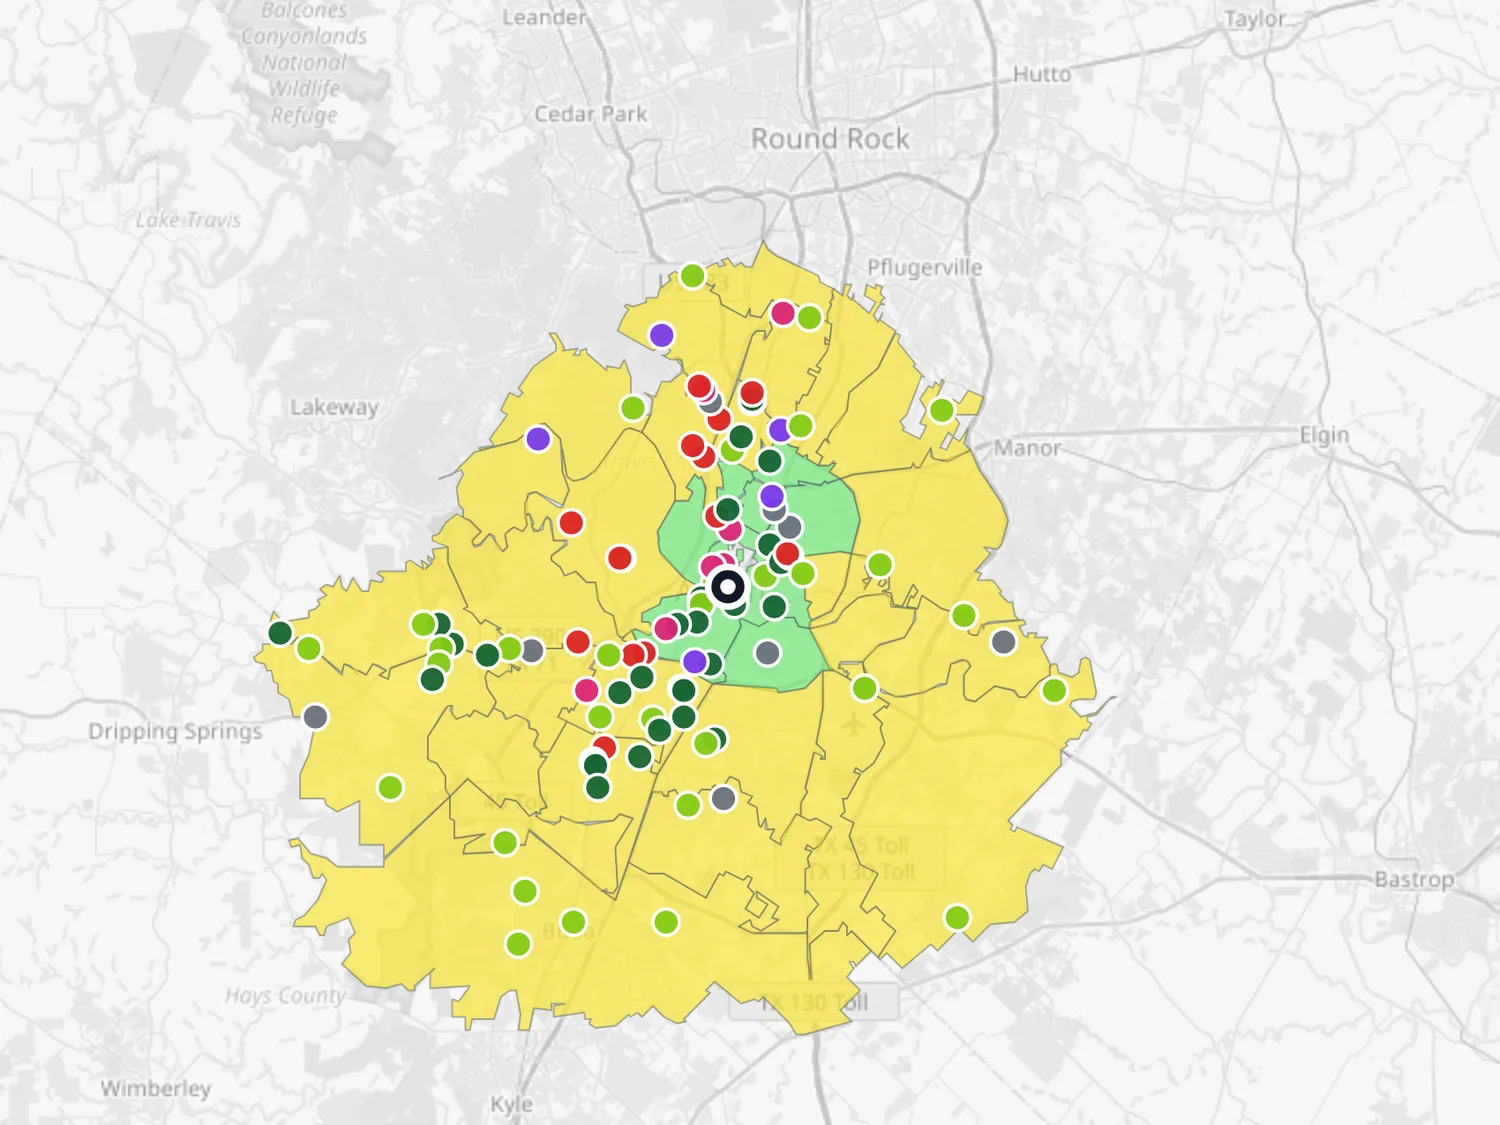
The Market Opportunity Score weighs demand, the number and affluence of dog-owning households, against the competing capacity already there. Drive-time bands show how many of those households are within a 15 or 30 minute drive of a site.
Compare candidate sites side by side before you sign a lease, and walk into the conversation with your lender or partners with numbers instead of instinct.
- Market Opportunity Score for every ZIP code in the trade area
- Drive-time bands from any address
- Key demographics: income, age, family mix and home ownership of dog households
One map, four decisions
From where to build to who to call
The same picture of your market answers the questions owners face at every stage.
Where to build
Demand against competing capacity, and the drive times that decide who will actually come.
Who you're up against
Every competitor by type and size, and who wins the map pack in each part of town.
Who already loves you
Your clients on the map, your market share by neighborhood, and the look-alikes nearby.
Where to spend
Target lists for every channel, aimed at the same neighborhoods, measured the same way.
Ask where your current customers live before buying any advertising. Most owners have never mapped it.
growth in returning-client boarding revenue in targeted neighborhoods, vs. +3.5% elsewhere
pet-care competitors mapped nationwide
of U.S. Census block groups modeled
How it works
A map of your market in one conversation.
Pick your area
Your address, or the sites you are considering, and the radius or drive time that matters.
See the market
Dog households, affluence and competitors for every neighborhood, with the opportunity score.
Add your clients
Upload a client list to see where your customers come from and your share of each neighborhood.
Act on it
Site comparisons for expansion, and target lists for your advertising.
Questions owners ask
Before you ask
Where does the data come from?
U.S. Census household data for every neighborhood, modeled for dog ownership and calibrated to national totals, plus a directory of pet businesses built from public listings.
Is my client list safe?
Your client list is never shared. The maps show counts by neighborhood, never individual addresses.
Does the opportunity score tell me exactly where to build?
No single score should. It shows where demand is strong relative to competition. Distance still matters most for a convenience purchase like boarding, so we use the score together with drive times and the competition around each site.
Can I see my Google rankings too?
Yes, for your own licensed locations: rank grids show who ranks first for searches like dog boarding near me at 113 points across your area.
Talk to us
See the dog households in your market.
A free neighborhood map. Tell us a little about your resort and we will set up a time.
- Your market's dog households and affluent households, by neighborhood
- Every competitor around you, on one map
- Where your next location or campaign should go
Prefer to call? (512) 900-1070 · [email protected]
Want the full details first? Read more about Dog Households
Preview: this is a copy of the site's existing contact form (Gravity Form 1). On the live page it submits normally, and its hidden fields record the QR code that was scanned.
Screens show an Austin, Texas demo map built from public census and business data. +17%: one two-location resort, March to September 2026 vs. 2025, targeted vs. non-targeted neighborhoods; an association, not a controlled test, and new-client boarding inside the targeted area did not rise.