Turn Data into Decisions: Why Every Pet Resort Needs a Strategic KPI Dashboard
Running a pet resort is no small feat. Between managing staffing schedules, customer inquiries, facility issues and more, there’s little time left to dig through complicated software reports and spreadsheets. But without clear visibility into your numbers, it’s easy to miss opportunities—or problems—until they’ve already impacted your bottom line.
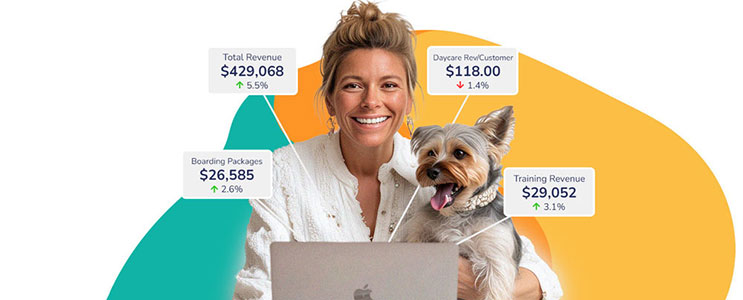
That’s why we created the Pet Resort Executive KPI Dashboard, a powerful reporting tool that transforms your existing Gingr data into crystal-clear business intelligence. With daily updates, you'll spot opportunities and catch problems as they’re happening, not weeks later when it's too late to act.
Clarity Instead of Complexity
Unlike the static reports built into most software, this dashboard is designed to answer the questions that matter most to your business:
- Are we growing? Year-over-year trends for revenue, customer counts, and new client acquisition
- Which services are most profitable? Revenue breakdown by boarding, daycare, grooming, and training
- Are packages helping or hurting? Package sales, usage, and revenue contribution by service
- Are we staffed and priced effectively? Revenue per customer and service utilization by department
- Where are we leaving money on the table? Departmental underperformance alerts with red flags
All of this is delivered in one interactive, visually engaging dashboard that’s updated daily and refreshed monthly.
What Makes This Different from Gingr Reports?
Gingr’s built-in reporting tools provide lots of raw data, but they often require time-consuming exporting and interpretation. The KPI Dashboard eliminates that frustration by:
- Giving you instant visibility into what’s working—and what’s not
- Providing a simplified, executive-level overview of your entire business
- Breaking down insights by services, customers, and packages to make your next move clear
Real-World Impact
Pet resort owners who have piloted the KPI Dashboard have used it to:
- Catch a 42% drop in package sales before it derailed their Q3 revenue
- Spot that return customers drive 90% of revenue and double down on retention programs
- Identify where new customer growth is up, but spend per client is trending down
- Pinpoint underperforming departments that needed pricing or staffing adjustments
This level of visibility doesn’t just help you operate more efficiently—it gives you the confidence to plan for growth, whether that means expanding locations, improving customer loyalty, or preparing for an eventual exit.
Built for Pet Resort Owners Who Want to Grow
The KPI Dashboard was built by experts who understand pet resort operations and the metrics that truly matter. For less than the cost of a single kennel run per month, you’ll have the data intelligence you need to:
- Reduce guesswork
- Improve team accountability
- Optimize marketing, pricing, and staffing decisions
- Strengthen investor conversations and long-term planning
Ready to See Your Business Clearly?
While your competitors drown in spreadsheets, you'll have crystal-clear insights. The Pet Resort Executive KPI Dashboard reveals exactly what's driving your success—and your biggest opportunities.
BOOK YOUR DEMO today!
Developed by pet industry veteran Mark Sherman, this dashboard was created specifically for executives who need a clear, actionable view of their business performance data. A digital marketing strategist and lifelong entrepreneur, Mark Sherman is also the Founder & President of Nehmedia, Inc. | Pet Resort Marketing and My Pets Text™.